 Getting out in the garden is a great pastime, and with the popularity of ‘growing your own’ on the rise again, many people are increasingly thinking about how to make their gardens and allotments more wildlife-friendly, as well as beautiful (and tasty)! There are lots of reasons to make space in your garden for wildlife – not least because many of the creatures that will happily make a home there are really helpful to our own growing efforts in their turn.
From pest control to pollination, beneficial insects are really helpful in the garden and very much worth making a bit of effort to attract. One way to show how useful they are and also give you an idea of how successful your horticultural endeavours have been, is to work out how much your garden produce would have cost if you had bought it – and how much of that the bees (and other insects) have helped with.
Enter the Garden Shop calculator, from LJBees and the Buzz Club at Sussex University.
What is it?
The ‘Garden Shop calculator’ is a spreadsheet that you can download from us, and use to keep a record of what fruits and vegetables you have harvested over the year. The interesting bit is that as you add weights or counts, the spreadsheet will calculate for you how much it would have cost you to buy that produce at the shop.
It also calculates how much of that value is directly a result of insect pollination. Different crops have different needs for pollination (from zero need for root crops like potatoes, or entirely self-pollinating crops like French beans; to apples and squashes which are 100% reliant on pollination). For tomatoes, for example, the need for pollination is about 25% – so 25% of your tomato yield is as a result of bee action. So if you grew £100-worth of tomatoes, your bees would have been responsible for £25 of that!
The ‘Garden Shop Calculator’ is free from Sussex University and the Buzz Club – all we ask is that you send us a copy back at the end of the year, with your values in it, so we can do a more detailed analysis of the data collected. Also see the FAQ, and ‘idea behind the project’ below for more information on this, and how to use the spreadsheet.
(Please note – if you cannot download / edit excel spreadsheets, let Linda know, and she can make a version that you can use online through Google Documents.)
Create your own user feedback survey

Note:
Note: This file will open in 'protected view' when you've downloaded it - this is because it is in an older version of Excel, and is being downloaded from an internet location Sometimes this causes validation errors with newer versions of Office (see the Microsoft Support Page on these errors). The file should be fine, although do give it a quick scan with your virus-checker if you're uncertain! Re-save it to your computer to get rid of the error.
More information / FAQs
How to use:
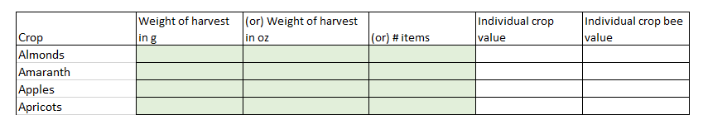
• Fill in only the GREEN boxes on the spreadsheet.
• Enter either the weight of your harvest, in grams or in ounces; or the number of items picked (such as, 5 apples).
• These categories are quite broad and do not take variety in account; the estimated values are based on an average of many different varieties of crop types. We might make this more detailed in future, but for now please just put all of the same type of crop together.
You can add data to the spread sheet in 2 ways:
1 - Total harvest. Keep a record of what you pick over the harvest season (in a notebook or similar). Add up the final total for each crop and add that total to the spreadsheet when you finish picking from that type of plant. This is the easiest option if you're not very familiar with spreadsheets!
2 - Ongoing. Add in numbers as you go along. For example, using apples:
If you have picked 500g of apples one day, type =500 in the “weight in grams” box, on the line for apples. If you then pick 450g the next time - double click the box that currently has 500 in then type 950 into the box ( i.e. 500+450). Excel will update with the new number.
Repeat the above process each time you have more numbers to add. Please remember to save the spreadsheet after each successful addition, it probably helps to keep the previous version until new numbers are added and saved in case of problems.
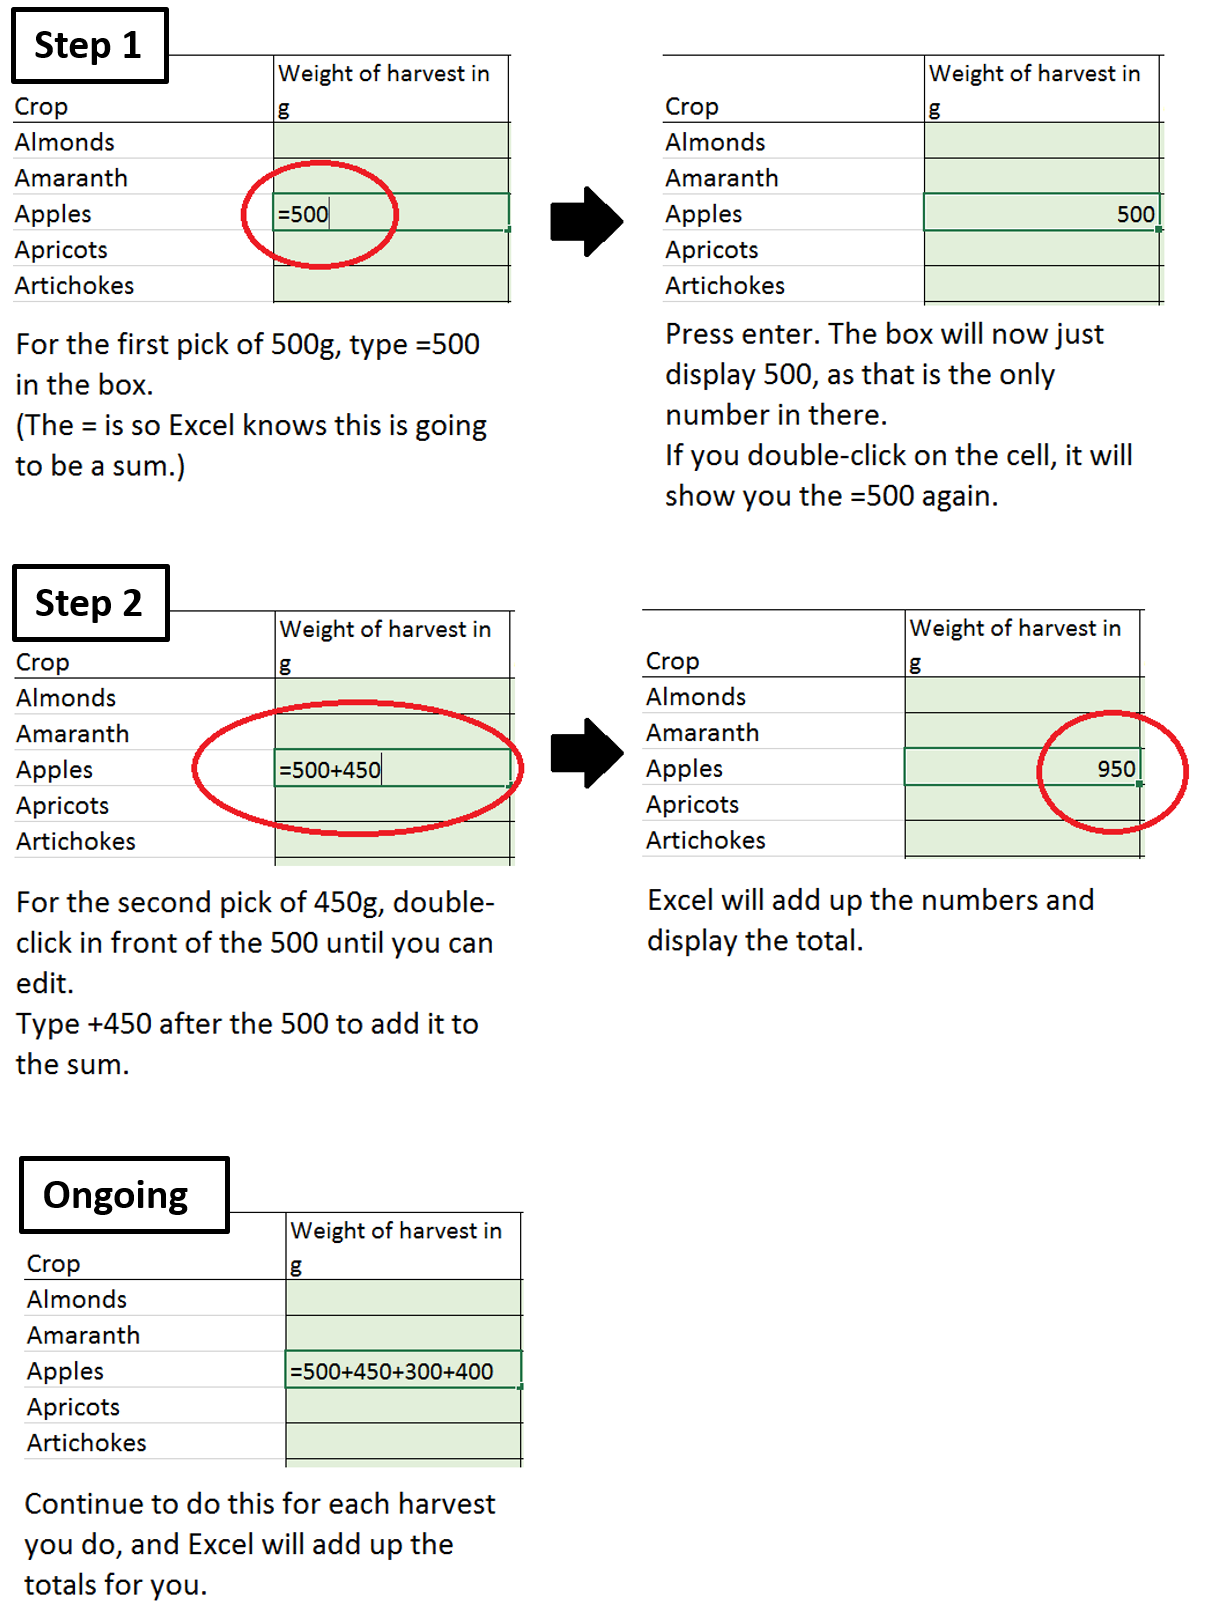
(Click to enlarge the example image)
-
Your calculated report:
The top of the page is a table labelled ‘report’.
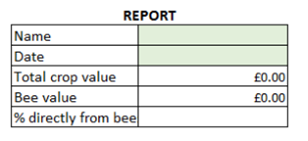
This will update automatically as you add more numbers for the listed crops. It gives you a harvested estimate of the values of your produce; both the ‘total’ shop value, and the ‘bee value’.
It also tells you what percentage of your total crop yield is directly the result of insect pollination (expect this to jump around a bit – if you’ve just harvested a lot of potatoes, it will be lower; but a few kilograms of apples will send it right up again!).
Ideas behind the Garden Shop calculator:
Last year, we ran a small project asking volunteers to record what pollinated fruits / vegetables they grew in their gardens & allotments over 2015. This information was sent back to Sussex, where we calculated how much each garden had produced, what it would have cost to buy, and how reliant the crops in question are on insect pollination (done by looking through the scientific literature to see where researchers have investigated the requirements of different sorts of plants).
We then returned the data to volunteers, giving them a total value and bee value for their gardens, as well as breaking it down by crop type. We were impressed by the results – total values ranged from about £10 to over £800, with the largest ‘bee value’ coming in at £427. This was apparently much more than the cost of renting the allotment space for that year; so those bees were really earning their keep!
This was a really interesting result, both for us at Sussex University and for the volunteers taking part, so we decided to run it again. This time however, we are providing a much nicer spreadsheet that volunteers can fill in as they go along and get an ‘as-harvested’ estimate of their garden values (including graphs, for those that like them). This spreadsheet is free to download from this website, or the Buzz Club site, and we will answer any questions or comments that you have about the project from either.
All we ask is that you send us a copy back at the end of the year, with your values in it, so we can do a more detailed analysis of the data collected. This is so that we can feed back more information as the summer progresses, and so that we know how many people are joining in it would be helpful if you would sign up here.
We will also be able to help you if your spreadsheet develops any problems.